Chapter 16 Curse of dimensionality demo
As the dimensionality of your data increases, your data become increasingly sparse in the space that they occupy. As a result, the distances between objects in your dataset become less meaningful as dimensionality increases. This dynamic can make some data mining techniques less effective (e.g., clustering or outlier detection).
In this activity, we will demonstrate the effect of dimensionality on distances in data.
16.1 Dependencies
We’ll use the rdist package to calculate distances between points.
Look over the documentation for rdist here: https://github.com/blasern/rdist.
The code chunk below will check if you have the rdist package. If not, it will install it.
rdist_available <- require(rdist)## Loading required package: rdistif (!rdist_available) {
install.packages("rdist")
}
library(rdist)We’ll also use the following libraries (if you don’t have these, you’ll need to install them):
library(tidyverse)16.2 Generate example data
num_points <- 500
min_range <- 0
max_range <- 1
dimension_sizes <- 2:50
dist_metrics <- c("euclidean", "angular")
Generate 500 points in an N-dimensional box (where each dimension of the box ranges from 0 and 1).
data <- data.frame(num_dimensions=c())
# For each dimensionality, randomly generate "num_points" points in our rectangle.
for (num_dimensions in dimension_sizes) {
# Generate random points in our N-dimensional box.
points_matrix <- matrix(
data = runif(num_points * num_dimensions),
nrow = num_points,
ncol = num_dimensions
)
# Calculate the pairwise distances between points in our dataset.
# Run ?rdist to see how the rdist function works
for (cur_metric in dist_metrics) {
distances <- c(rdist(points_matrix, metric=cur_metric))
dim_data <- data.frame(
max_dist = c(max(distances)),
min_dist = c(min(distances)),
metric = c(cur_metric),
num_dimensions = num_dimensions
)
data <- rbind(data, dim_data)
}
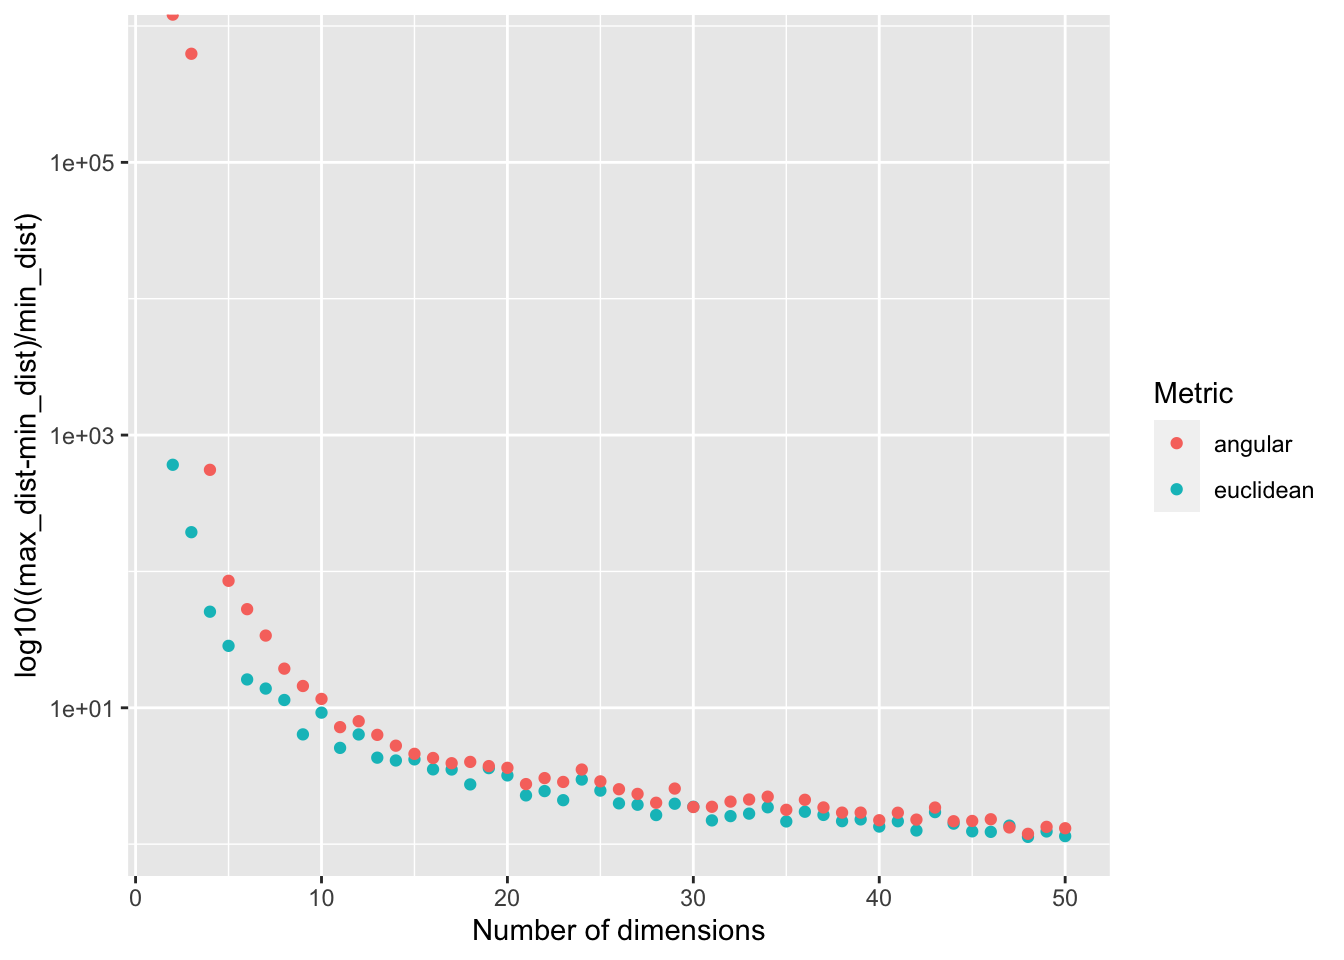
}We can get a rough idea of how meaningful the distances in our space are by calculating
(max_dist-min_dist)/min_dist.
ggplot(
    data,
    aes(
      x=num_dimensions,
      y=((max_dist-min_dist)/min_dist),
      color=metric,
      fill=metric
      )
    ) +
  geom_point() +
  scale_y_continuous(
    name="log10((max_dist-min_dist)/min_dist)",
    trans="log10"
  ) +
  labs(
    x="Number of dimensions",
    color="Metric",
    fill="Metric"
  )