Chapter 30 Sequential pattern mining in R
The main goal of this lab activity is to provide a beginner-friendly introduction to performing sequence pattern mining in R using the arulesSequences package.
In this lab activity, we will
- use the
arulesSequencespackage to perform sequential pattern mining - load basic sequence data from file (with the appropriate format for the
arulesSequencespackage)
30.1 Dependencies
We’ll use the following packages in this lab activity (you will need to install any that you don’t already have installed):
library(tidyverse)        # For data wrangling, visualization
library(arulesSequences)  # For sequential pattern mining algorithms
##
## Attaching package: 'arulesSequences'## The following object is masked from 'package:arules':
##
## itemsetslibrary(cowplot) # For a nice ggplot theme
library(khroma)
theme_set(theme_cowplot()) # Set the cowplot ggplot theme as the default.Find the documentation for the arulesSequences package here: https://cran.r-project.org/web/packages/arulesSequences/index.html.
30.2 Data preparation and inspection
In this lab, we’ll load our sequences from file: sequences.dat, which you can download on blackboard or you can access it online here.
Before continuing on with loading these data, take a look at sequences.dat.
Each line describes part of a sequence.
Notice that each line is formatted as follows:
sequence id (sequenceID), itemset id (eventID), itemset size (size), and then all items in the itemset separated by commas.
For example, then line 2,1,1,a,b describes the first itemset in sequence 2; this itemset is size 2 with the following items: a and b.
Notice that you need to look at multiple lines to see all of the itemsets in sequence 2.
This isn’t a well-formed .csv file (variable number of items trailing on each line), hence I have opted to use the .dat extension instead of a .csv extension.
We can use the read_baskets function from the arulesSequences package to read our file containing itemset sequences.
# You may need to adjust the path to the sequences.dat file.
seqs <- arulesSequences::read_baskets(
  "lecture-material/week-12/sequences.dat",
  sep = ",",
  info = c("sequenceID", "eventID", "size")  # Identities of first N columns
)
We can use the inspect function provided in the arulesSequences package to view our data:
arulesSequences::inspect(seqs)## items sequenceID eventID size
## [1] {a, b} 1 1 2
## [2] {c} 1 2 1
## [3] {a} 1 3 1
## [4] {a, b} 2 1 2
## [5] {b} 2 2 1
## [6] {c} 2 3 1
## [7] {b} 3 1 1
## [8] {c} 3 2 1
## [9] {d} 3 3 1
## [10] {b} 4 1 1
## [11] {a, b} 4 2 2
## [12] {c} 4 3 1If you want to view the set of items represented across all sequences in our data, you can use the itemLabels function:
itemLabels(seqs)## [1] "a" "b" "c" "d"To view the frequency of each item, you can use the itemFrequency function:
itemFrequency(seqs)## a b c d
## 0.33333333 0.50000000 0.33333333 0.0833333330.3 Finding frequent subsequences
The arulesSequences package provides an implementaiton of the cSPADE algorithm.
For more information about how the cSPADe algorithm works, see the following paper:
Zaki. 2000. Sequence mining in categorical domains: incorporating constraints. In Proceedings of the ninth international conference on Information and knowledge management (CIKM ’00). Association for Computing Machinery, New York, NY, USA, 422–429. https://doi.org/10.1145/354756.354849
Here, we set our minimum support threshold to 0.75; that is, we require that subsequences appear in at least 75% of sequences in our dataset to be considered frequent.
# Apply the cspade algorithm to our seqs dataset
freq_seqs <- cspade(
  seqs,
  parameter = list(
    support = 0.75
  )
)
The inspect function lets us view the frequent subsequences:
inspect(freq_seqs)## items support
## 1 <{a}> 0.75
## 2 <{b}> 1.00
## 3 <{c}> 1.00
## 4 <{a},
## {c}> 0.75
## 5 <{b},
## {c}> 1.00
## 6 <{a,
## b},
## {c}> 0.75
## 7 <{a,
## b}> 0.75
## We can convert the frequent subsequences into a data frame, which makes it easier to use tidyr and ggplot to further analyze the frequent subsequences.
# Create a dataframe with the frequent subsequences we found
freq_seqs_df <- as(freq_seqs, "data.frame")
Using the dataframe version of our frequent subsequences, we can more easily use ggplot to visualize support for frequent subsequences in our dataset:
# Adapted from: https://jlaw.netlify.app/2020/11/01/sequence-mining-my-browsing-history-with-arulessequences/
ggplot(
    freq_seqs_df,
    aes(
      x = fct_reorder(sequence, support),
      y = support,
      fill = sequence
    )
  ) +
  geom_col() +
  geom_label(
    aes(
      label = scales::percent(support)
    ),
    hjust = 0.5
  ) +
  labs(
    x = "Subsequence",
    y = "Support",
    title = "Frequent sequences",
    caption = "Support gives percent of sequences with given subsequence"
  ) +
  scale_fill_vibrant(
    guide = "none"
  ) +
  scale_y_continuous(
    labels = scales::percent,
    expand = expansion(mult = c(0, .1))
  ) +
  coord_flip()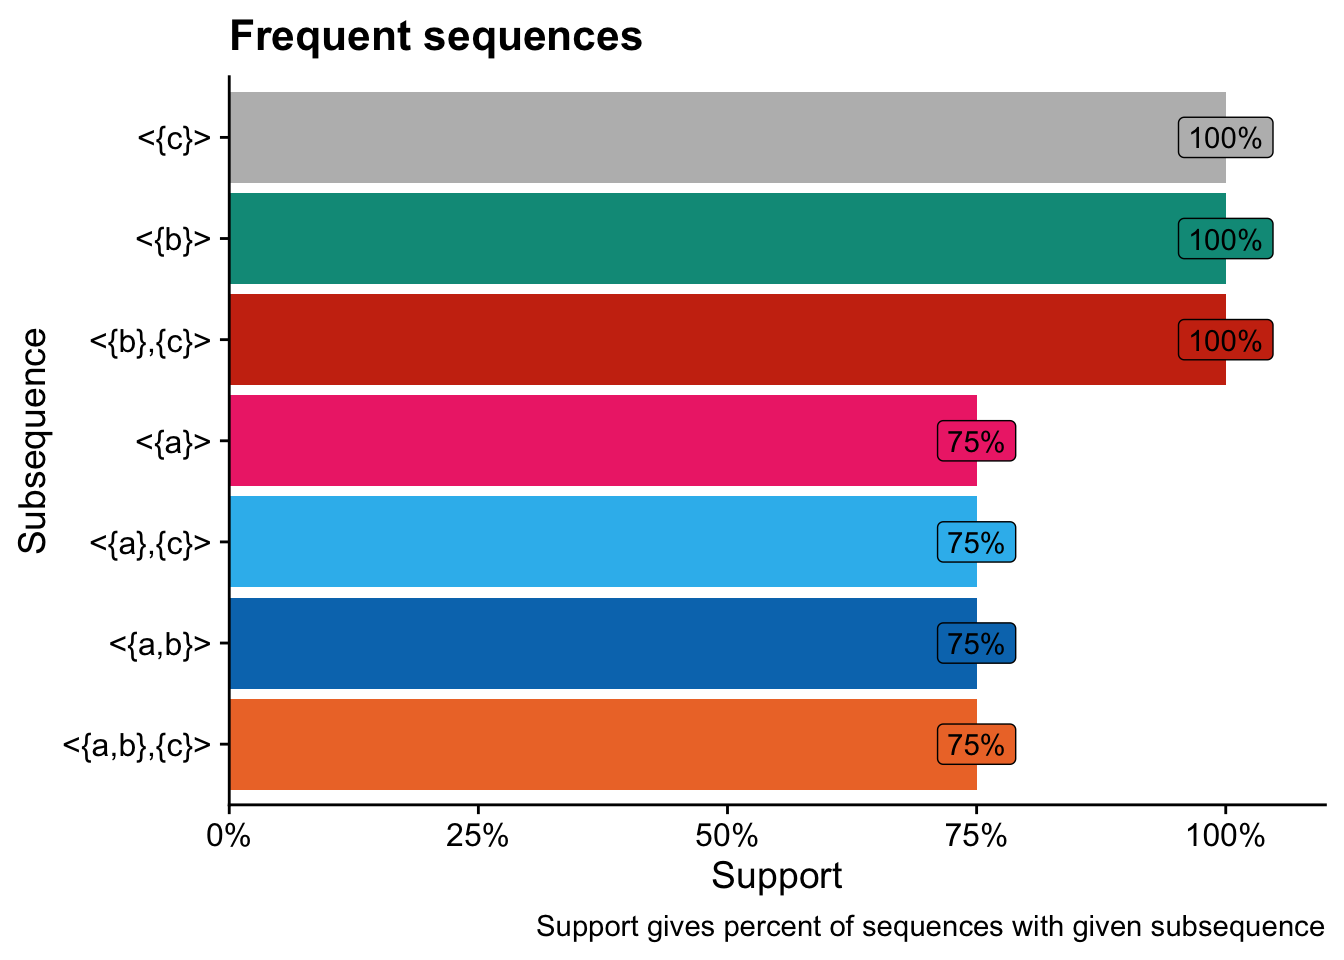
30.3.1 Rule generation
We can generate high-confidence rules from the frequent subsequences that we found using the ruleInduction function from the arulesSequences package.
Below, we compute all rules with confidence greater than 0.75.
rules <- ruleInduction(
  freq_seqs,
  confidence=0.75
)
Again, we can use the inspect function to view the rules we found:
inspect(rules)## lhs rhs support confidence lift
## 1 <{a}> => <{c}> 0.75 1 1
## 2 <{b}> => <{c}> 1.00 1 1
## 3 <{a,
## b}> => <{c}> 0.75 1 1
## 30.4 Exercises
- Adjust the support threshold used for finding frequent subsequences. What happens if you increase the support threshold? What happens if you decrease the support threshold?
- Describe a type of data that you think would be interesting to apply sequential pattern mining to. What do sequences represent? What does each itemset represent? What does each item represent? At a high level (not mathematically), what does it mean for a subsequence to be frequent in the context of your chosen domain?
- What would it mean to apply frequent subsequence mining to a database of words? You could assume each word is a sequence of size-1 itemsets.
- Apply sequential pattern mining to wordle data: wordle.csv
- To use the
cspadefunction inarulesSequences, you will need to preprocess the data into the expected format (i.e., likesequences.dat).
- To use the
30.5 Further exploration
- In the following blog post, the author uses R to apply sequential pattern mining to their web browsing history: Sequence Mining My Browsing History with arulesSequences
- For more information on the cSPADE algorithm, see Zaki. 2000. Sequence mining in categorical domains: incorporating constraints. In Proceedings of the ninth international conference on Information and knowledge management (CIKM ’00). Association for Computing Machinery, New York, NY, USA, 422–429. https://doi.org/10.1145/354756.354849
30.6 References
arulesSequencesDocumentation: https://cran.r-project.org/web/packages/arulesSequences/index.html- Sequence Mining My Browsing History with arulesSequences by JLaw
- Zaki. 2000. Sequence mining in categorical domains: incorporating constraints. In Proceedings of the ninth international conference on Information and knowledge management (CIKM ’00). Association for Computing Machinery, New York, NY, USA, 422–429. https://doi.org/10.1145/354756.354849